Learning Outcomes
By the end of this lesson, students should be able to:
i. Explain the concept of isotopes, including the variation in atomic mass due to the presence of different numbers of neutrons in atomic nuclei.
ii. Describe the use of mass spectrometry for determining the relative isotopic masses of elements and the abundance of different isotopes.
iii. Interpret mass spectra to identify the presence of different isotopes and calculate their relative abundances.
iv. Appreciate the importance of mass spectrometry in various applications, including isotopic dating, environmental monitoring, and pharmaceutical analysis.
Introduction
Isotopes, atoms of the same element with different numbers of neutrons, exhibit unique properties, including variations in atomic mass. Mass spectrometry, with its ability to separate and detect ions based on their mass-to-charge ratio (m/z), has become a powerful tool for determining isotopic masses and abundance. This lesson delves into the application of mass spectrometry in isotopic analysis, guiding students through the interpretation of mass spectra and the calculation of isotopic abundance.
i. The Isotopic Landscape: A Tale of Neutron Numbers
Isotopes of an element have the same number of protons but differ in the number of neutrons in their nuclei. This variation in neutron number leads to differences in atomic mass, as neutrons contribute to the overall mass of an atom.
ii. Mass Spectrometry: A Window into the Isotopic World
Mass spectrometry provides a precise and accurate method for determining isotopic masses and abundance. By measuring the m/z values of ions, mass spectrometers can distinguish between isotopes based on their mass differences.
Isotopic Patterns: A Fingerprint of Elements
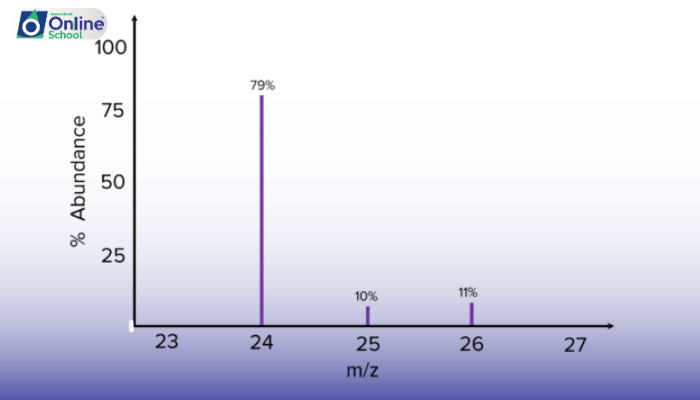
Mass spectra of elements exhibit characteristic isotopic patterns, with peaks corresponding to different isotopes and their relative abundances. The intensity of each peak represents the abundance of the corresponding isotope.
Relative Isotopic Abundance: Quantifying the Isotope Mix
Relative isotopic abundance is calculated by dividing the intensity of each isotope peak by the total intensity of all isotope peaks. This provides a percentage representation of the relative abundance of each isotope.
iii. Interpreting Mass Spectra: Unveiling Isotopic Composition
By analyzing mass spectra, scientists can infer the isotopic composition of a sample:
Identify Isotope Peaks: Recognize isotope peaks based on their m/z values and their spacing compared to the main ion peak.
Calculate Relative Abundance: Determine the relative abundance of each isotope using peak intensity ratios.
Characterize Isotopic Composition: Summarize the isotopic composition of the sample, including the presence of different isotopes and their relative abundances.
iv. Applications beyond the Ordinary: The Versatility of Mass Spectrometry
Mass spectrometry in isotopic analysis extends beyond basic research and finds applications in various fields:
Isotopic Dating: Determining the age of archaeological artifacts, geological formations, and meteorites.
Environmental Monitoring: Tracing the sources of pollutants and monitoring their distribution in the environment.
Pharmaceutical Analysis: Ensuring the purity and quality of pharmaceutical compounds, including the identification and quantification of isotopic variants.
Mass spectrometry, with its ability to distinguish isotopes based on their mass differences, has revolutionized the field of isotopic analysis. By interpreting mass spectra and calculating relative isotopic abundance, scientists can gain insights into the isotopic composition of various samples, with applications ranging from understanding planetary formation to ensuring drug safety. Mass spectrometry stands as a testament to the power of scientific instrumentation in unraveling the mysteries of the isotopic world.
